Environmental Measurement Results
During the eclipse, I used various data loggers from Onset
Computer Corporation to automatically record the ambient light levels,
temperature, and relative humidity during the entire solar eclipse (from
first contact through fourth contact). Many thanks to Onset Computer,
which graciously lent me these loggers at no cost.
Thumbnail pictures of the various environmental graphs are shown below.
To view a particular graph in full resolution, click on its thumbnail.
This same page complete with all environmental graphs at full resolution
instead of thumbnails is also available:
Environmental Measurement Results
page with full graphs
Light Intensity
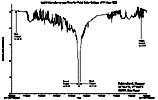
One of the HOBO®
Light Intensity loggers was pointed at the zenith and recorded the
light intensity every eight seconds during the eclipse (see graphs above).
It was placed away from foot traffic on the balacony where I had set up
the rest of my equipment. The light intensity results (above) have
been plotted on a logarithmic scale (log(Lumens/square foot)) because the
light levels changed by several orders of magnitude during the eclipse.
At first and fourth contact, the light level was about 1300 lumens/square
foot with the sun at an altitude of 53.5° and
54.3° respectively. During totality (sun
at altitude of 58.4°), the light level dropped
by a factor of 52,000 to only 0.025 lumens/square foot. The graphs
shows the effects of thin and thick scattered cloud in the area between
first and second contact, causing local fluctuations in the light level
by factors up to 4. It is interesting to note that most of the change in
light level occurs in the twenty minutes before and after totality. The
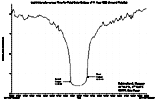
graph showing the light levels for ten minutes before and after totality
illustrate the accelerated decrease in light level, dropping by a factor
of 6300 in less than nine minutes. In the last two minutes before
second contact, the light level dropped by a factor of 1000. After
third contact, the light levels rose rapidly at similar rates. The
measurements are consistent with my qualitative observations. I did
not observe any noticeable difference in the light until about 20 minutes
before totality, when the light started to take on a grey characteristic.
The grey/silver-like light became more and more noticeable as totality
approached. In the last ninety seconds before second contact, I could
easily discern the rapid and accelerating decrease in light. It felt
like an almighty force was turning a down a dimmer switch on the sun high
in the sky.
-
-
Light Intensity versus Time (Zenith)
-
-
Light Intensity versus Time (Zenith) - detail around totality
The other HOBO®
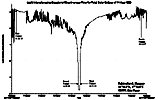
Light Intensity logger was kept pointed directly at the sun.
Michael Koop, a fellow ATMoB group member,
was generous enough to allow me to affix the logger to his clock-driven
Great Polaris equatorial mount so that the logger's sensor was facing directly
toward the sun/corona. He was located on the ground with the others
from the ATMoB group behind the Marina Hotel. The light level
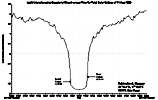
measurements taken with this "equatorial sensor" are very similar in trend
compared to those at the taken with the logger pointing at the zenith,
but are about 1.5 times lower. A possible explanation for this is
that the lighting level for this sensor at ground level may have been decreased
slightly by reduced visibility to the horizons by the trees and the hotel
building nearby. The directivity of the light sensor obeys a cosine
relationship for angles between +45°, so
the sensor high on the balcony could get more light from the illuminated
sky while the ground level sensor would have much of this light unavailable.
-
-
Light Intensity versus Time (normal to Sun)
-
-
Light Intensity versus Time (normal to Sun) - detail around totality
The measurements from the StowAway®
light intensity logger were not quite as useful. While the StowAway®
had more memory (i.e. it could collect samples), its sensor saturated for
light levels greater than about 1000 lumens/sq ft. The measurements
for light levels lower than this were generally similar to those for the
HOBO® light intensity loggers. As time permits, I may also post
the results from the StowAway® here as well.
Temperature
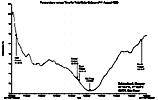
I also measured the temperature and relative humidity using a HOBO®
H8 Pro RH/Temperature Logger hung in the shade of a tree at ground
level in a grassed area. At first contact, the temperature was 78.0°F.
At second contact, the temperature had dropped to 73.4°F
due to the moon's covering of the sun and resultant reduction in solar
radiation. However, the minimum temperature of 72.4°F
was not reached until 13 minutes after totality had ended, demonstrating
the delayed effect of solar heating. The effect of the thicker cloud
banks in the area can be seen in the temperature measurements as there
are local minimums in temperature before and after totality. By fourth
contact, the temperature had risen up back up to 77.5°F.
The eclipse caused a drop in temperature of 6.6°F
(3.7°C) during the late morning and early afternoon
when the temperature is typically rising. I definitely noticed the
cooling effect as the eclipse progressed and especially in the minutes
after totality.
-
-
Temperature versus Time
Relative Humidity
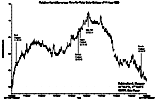
As the temperature dropped, the relative humidity increased. It measured
57% at first contact, and rose to 67% by the end of totality. The
highest relative humidity of 73% was measured 11 minutes after totality
ended, about two minutes before the minimum temperature was reached.
By fourth contact, the air had dried to a relative humidity of 52%.
-
-
Relative Humidity versus Time
Comments and Questions
This was my first attempt at environmental measurements, and I welcome
any comments, suggestions, or questions on these measurements.
Please contact Eric Pauer at pauer@bit-net.com
if you would like an electronic copy of the actual data from any or all
of the loggers (Microsoft Excel or Text format available). In the
near future, I plan to post some graphs relating light intensity, temperature,
and relative humidity as functions of eclipse obscuration.
Next
Chapter - Additional Video Frames
Previous
Chapter - Third Contact and Beyond
Table of Contents
Eric's 1999 Total Solar Eclipse Home
Page
Eclipse Circumstances
and Where to View?
Vacation in Budapest
Eclipse Day Eve
Eclipse Day
My Equipment Setup
Planned Environmental Measurements
First Contact and Moon's Shadow
Totality!
Third Contact and Beyond
Environmental Measurement Results
Additional Video Frames
Additional Eclipse Photos
Eclipse Links
Email comments, questions, or suggestions to Eric Pauer at pauer@bit-net.com.
This page was last updated on 2 August 00.


